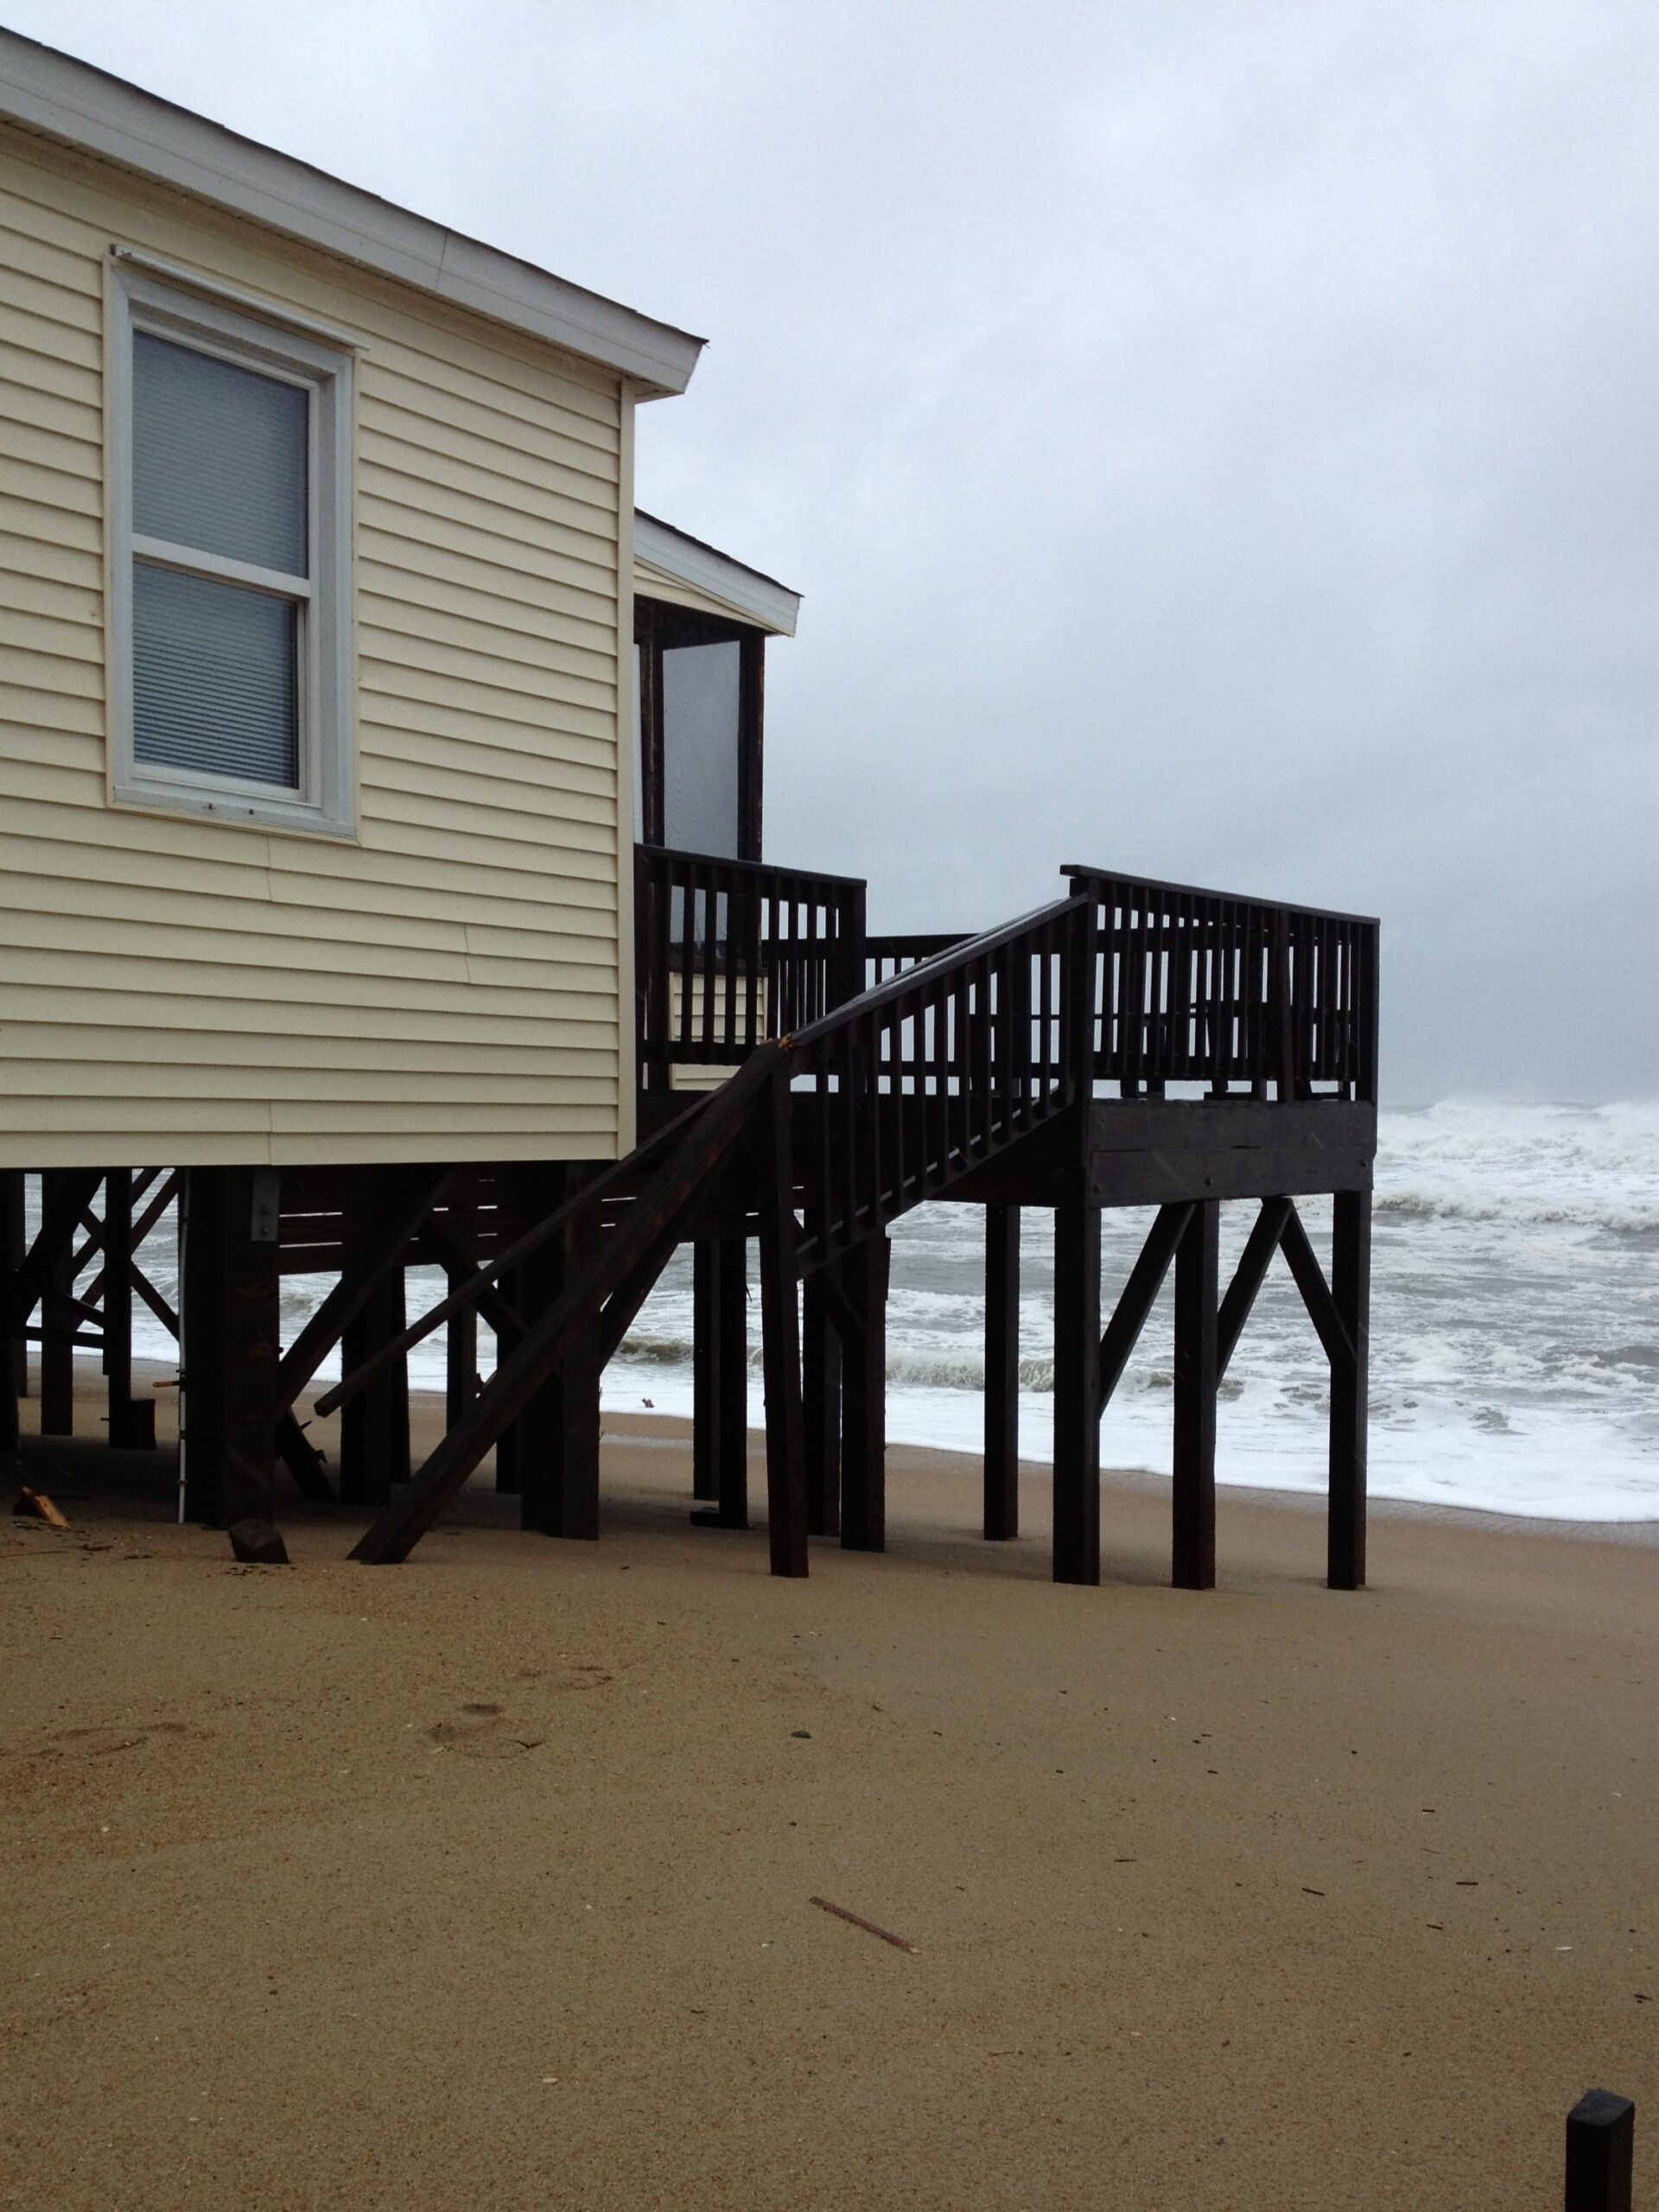
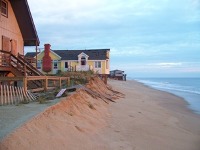
 Erosion is discussed frequently on the Outer Banks. You’ll see many spots where there is no house between the ocean and the road as you drive down NC12 in Kitty Hawk. Unfortunately, erosion took homes that were once there. North Carolina prohibits jetties or bulkheads and other hard structures on the ocean front. Therefore, the ocean front homes are at the mercy of the sea. As a result, it is a good idea to look at an Outer Banks erosion chart before buying ocean front property. Here’s some information on how to do that.
STATE MAPS
The erosion rate is determined by regular measurements of the first line of vegitation. This is where the beach grass stops and the beach begins. The state finds that line and calculates the average change over a 50 year period. Here’s a link to North Carolina’s web site where the annual erosion rate is shown. The state periodically changes their rate based on new measurements.
Below is a video with instructions on how to see the state charts for Outer Banks erosion. Many different overlay maps are available here. To see the erosion rate for a specific area, zoom into that location and add the erosion rate overlay. The red or green bar shows the current rate. (red is for erosion and green is for accretion). Believe it or not, there are quite a few areas where the beach is actually building!
Beach Nourishment

Beach nourishment projects have been started in most erosion prone areas of Dare County. These beach nourishment projects have created a renaissance for the erosion prone areas. At this time, owners are now improving and maintaining their ocean front homes becaue they are less likely to loose their home to erosion.
When you are thinking about an Outer Banks ocean front purchase, it’s a good idea to check out an Outer Banks erosion chart. This will help you determine if a property is a good investment or if you should look at other properties.


